07. Chart Choice
Resources for creating visualizations
- Chart Chooser diagram is a great website that encapsulates early visualization ideas: Chart Chooser diagram
- Similarly, the following website serves a nice guide as well: Juice Analytics
- Here is a blog Graphic Continuum site that is particularly informative as well
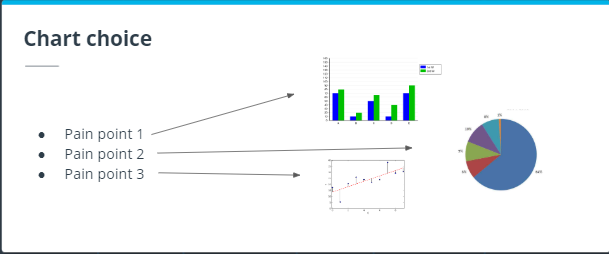
Chart choice text
Currently there is no one definition of what a dashboard is or isn’t, but I want you to think of your dashboard as collection of charts each designed to answer a specific question. Together the collection of charts work together to support your audiences decision making from multiple angles.
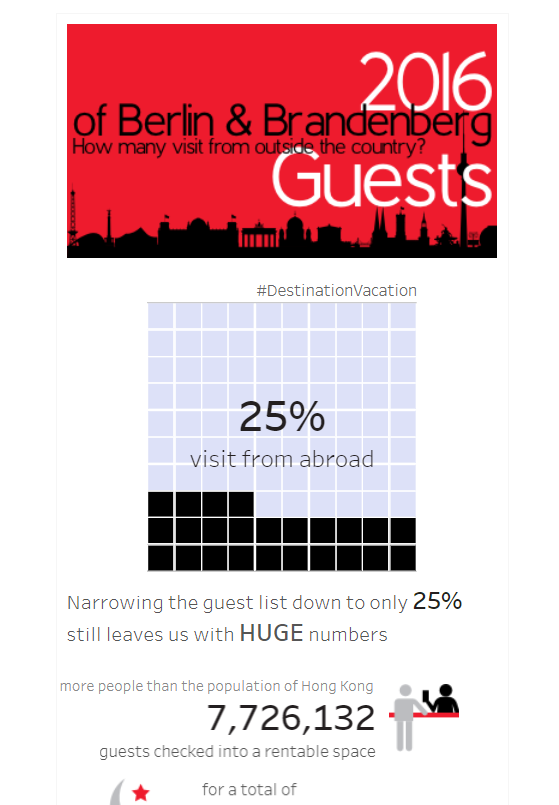
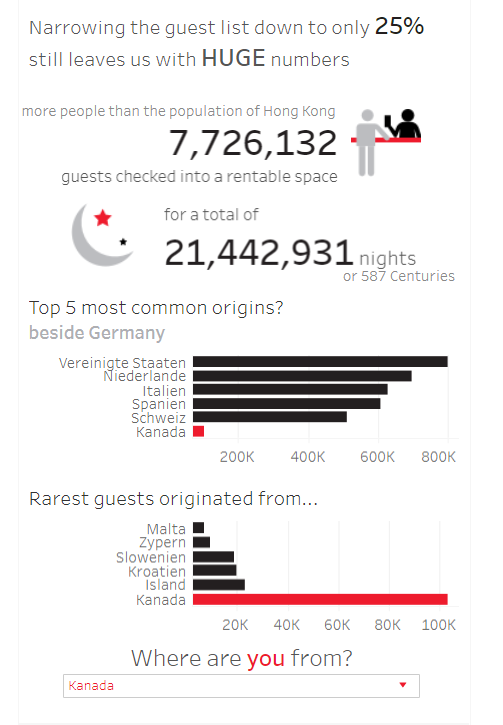
Makeover Monday is a website that offers learning opportunities to data people by providing datasets to explore data visualizations with.
Recently, participants were asked to display the percent of visitors to Berlin and Brandenburg. Here is my dashboard that I created. As you can see, percent of total is a composition question. While pies are a common choice to depict that, I used a waffle chart to depict the same. It conveys the same message as a pie chart, but I wanted a real estate than a pie chart.
In summary, every question or priority posed by your audience is an opportunity to design a chart to visually answer their question.